On the night of June 1st in 2019, Liverpool would go on to win their 6th Champions League, their first since the dramatic final in 2005 and also the first major trophy won under Jurgen Klopp who joined the club in 2015. That night was significant for many reasons but a strange statistic caught my attention:
The 11 players that started in the Champions league final had never started a game together before, and has never started again since.
The rest of this article will explore the data around this statistic and uncover why this team has only ever started together once.
Starting 11 for the final
This starting lineup is remembered by many fans as the defining team of that era and many of the comments from the reddit post capture why the statistic above is so unintuitive.
Comments on the stat from reddit
So how can this be possible? To try and uncover the mystery we can start by looking at the data from the games played during that season and extract the starting 11 from each game.
1 Data Collection
There are many free resources for football data, but transfermarket seemed to be the best option to minimise the post-processing needed for this analysis. The code used to scrape this data can be found here - the key libraries used were pandas, beautifulsoup and requests.
Data collection and processing libraries
import sys# filter pandas warnings before importingimport warningswarnings.simplefilter(action='ignore', category=FutureWarning)import pandas as pd# haven't published library to pypi yet so add local folder to path# see https://github.com/ismailmo1/football-data-viz/tree/main/transfermarketmodule_path ='/home/ismail/projects/football-data-viz/transfermarket/'if module_path notin sys.path: sys.path.append(module_path)from transfermarket import leagues, players, teams
We’re only interested in the starting 11 from the final so the we can filter out the other players from the squad:
cl_19_lineup = ['Trent Alexander-Arnold','Georginio Wijnaldum','Fabinho','Jordan Henderson','Roberto Firmino','Mohamed Salah','Joel Matip','Virgil van Dijk','Sadio Mané','Andrew Robertson','Alisson']cl_19_lineup_urls = {player:"https://www.transfermarkt.com"+ url for player, url in lpool_19_players.items() if player in cl_19_lineup}
For each of these players we can grab their availability for each game.
get_player_availability scrapes the statistics page for each player and determines which availability category a player falls into for that game.
The categories are:
Injured
Not in squad
Bench
Played (sub)
Played (starter)
avail_18_19 = []for player,url in cl_19_lineup_urls.items(): avail_df = players.get_player_availability(url,"2018") avail_18_19.append(avail_df)
2 Data Processing
Most of the data processing is done in a separate module (see code here) but for this specific analysis we want to ensure we are only looking at data related to Liverpool fixtures, since the player availability data will also include international games for their country.
There are also cases where the availability doesn’t fall into any of the categories above, so in that case we assume that they weren’t in the squad. This usually occurs when the player is suspended since the web-scraping logic doesn’t account for that (yet) - but there could also be other cases where transfermarket’s description doesn’t meet any of the logic defined in the web-scraping functions. We’ll see some more examples later where there are rooms for improvement in the web-scraper and the visualisations help identify these.
# assumption: NaN value means they were likely suspended# either way they werent in the squad so makes sense # to assign that (to me atleast!) fixtures_num_starters.fillna(1, inplace=True)fixtures_num_starters = fixtures_num_starters.iloc[:,:11]
The number of players in the starting lineup can be calculated from the availability category they were put into: we can take a sum of all the instances of “Played (starter)” for each game.
This is what our processed data looks like (showing first 5 rows only)
virgil-van-dijk
andrew-robertson
alisson
georginio-wijnaldum
roberto-firmino
jordan-henderson
sadio-mane
joel-matip
fabinho
trent-alexander-arnold
mohamed-salah
strangers_count
0
4.0
4.0
4.0
4.0
4.0
3.0
4.0
1.0
2.0
4.0
4.0
8
1
4.0
4.0
4.0
4.0
4.0
3.0
4.0
2.0
1.0
4.0
4.0
8
2
4.0
4.0
4.0
4.0
4.0
3.0
4.0
3.0
1.0
4.0
4.0
8
3
4.0
4.0
4.0
4.0
4.0
4.0
4.0
3.0
1.0
4.0
4.0
9
4
4.0
4.0
4.0
4.0
4.0
3.0
4.0
3.0
2.0
4.0
4.0
8
3 Initial Visualisation
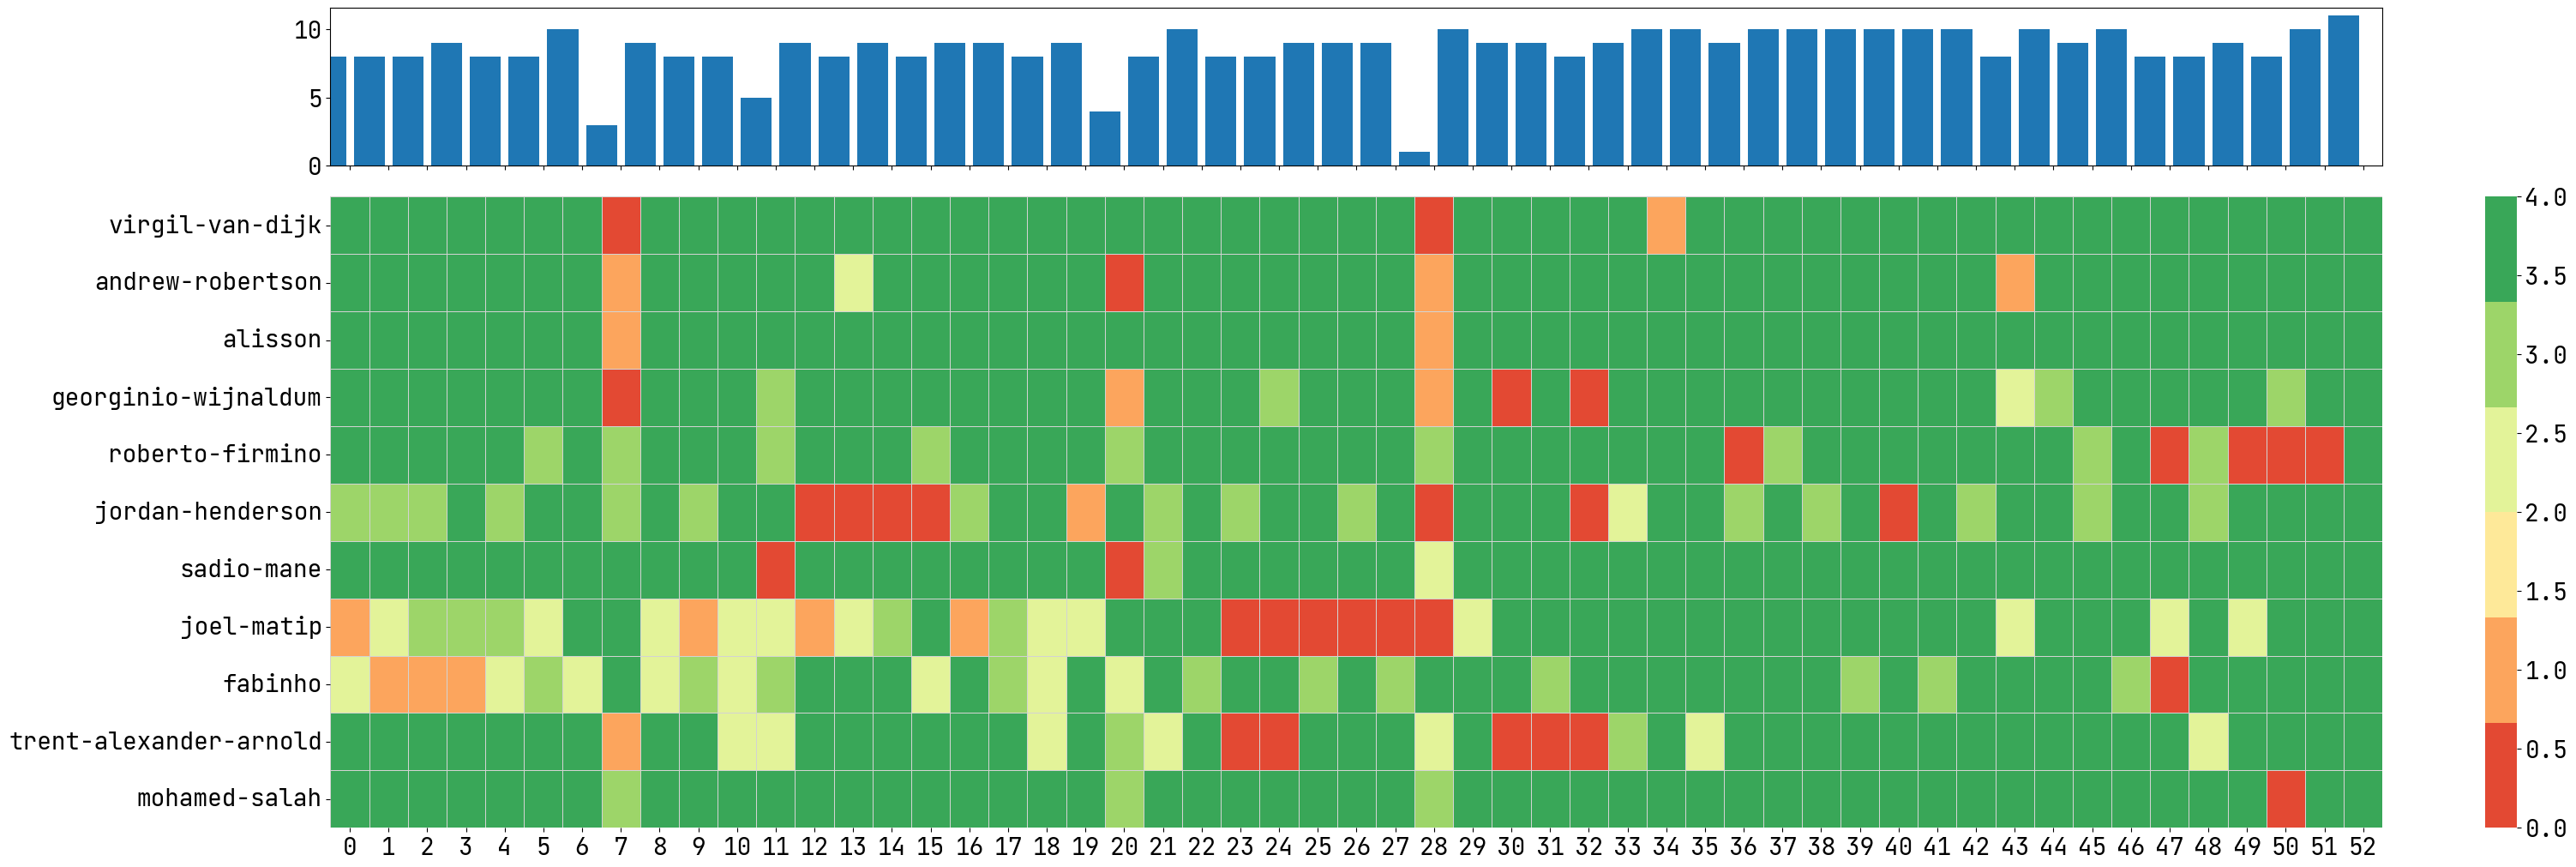
Now for the fun part! Since our data is 2 dimensional : players and dates, a heatmap seems like it would be a good way to to visualise the availability of each individual player over the course of the season, and a bar plot to keep count of how many of them started the game:
Visualisation libraries
import matplotlibimport matplotlib.pyplot as pltimport seaborn as snsmatplotlib.rcParams['font.family'] ='JetBrains Mono'matplotlib.rcParams['font.size'] ='20'
While this plot still needs a lot of work and cleanup - it’s a nice way to visualise the data - we can see that the final column in the heatmap is the only time when all boxes are green: of course this is the night of that champions league final.
There are quite a few things to fix in the visualisation here:
Add titles and labels to axes
Change y tick labels in player count bar plot to include max (11)
Replace color bar with text instead of numbers to map availability level categories
Improve color scheme to make it more accessible
Align the bars in the bar plot so it is aligned with the heatmap squares - currently it is offset
Before we address the visualisation adjustments, lets grab some data for the previous season (2017/2018) so we can add some more context around the statistic:
avail_17_18 = []for player,url in cl_19_lineup_urls.items(): avail_df = players.get_player_availability(url,"2017", add_match_result=True)# add liverpool fixture data avail_df = avail_df.T.join(liverpool_fix_17_18, how="right", rsuffix="_lpool") avail_17_18.append(avail_df.T)
More data, more problems - we now need to account for when players didn’t play for Liverpool - e.g. Virgil Van Dijk only join in January 2018 and was playing for Southampton during the first half of the season:
vvd_idx = [idx for idx, df inenumerate(avail_17_18) if'virgil'in df.index[0]][0]
avail_17_18[vvd_idx].iloc[:5, :5].dropna(axis=1)
Date
2017-08-12
2017-08-19
2017-08-23
virgil-van-dijk
0
0
0
Home team.1
Southampton (11.)
Southampton (11.)
Southampton
Away team.1
Swansea (12.)
West Ham (20.)
Wolves
Result
0:0
3:2
0:2
Matchday
1
2
Qualifying Round 2nd leg
We can account for this by adding another category to our availability levels:
def is_liverpool(rw):try:if'Liverpool'in rw['Home team.1'] or'Liverpool'in rw['Away team.1']:returnTrueelse:returnFalseexceptTypeError:returnFalsevvd = avail_17_18[vvd_idx].Tvvd['is_lpool'] = vvd.apply(is_liverpool, axis=1)def add_diff_team_availability(rw):"""add -1 if player isn't playing a liverpool game"""if rw['is_lpool'] ==False:return-1else:# availability colreturn rw[0]vvd.iloc[:,0] = vvd.apply(add_diff_team_availability, axis=1)
This heuristic doesn’t work when they play against Liverpool for their old club - but we can just fix that manually since it’ll be easy to spot (one game for Liverpool surrounded by loads of games for Southampton will stick out like a sore thumb)
vvd.sample(5).iloc[:, :3].dropna()
virgil-van-dijk
Home team.1
Away team.1
Date
2018-05-06
4
Chelsea (5.)
Liverpool (4.)
2018-02-11
4
Southampton (15.)
Liverpool (3.)
2018-04-21
4
West Brom (20.)
Liverpool (3.)
2017-11-29
-1
Man City (1.)
Southampton (10.)
2018-02-04
4
Liverpool (3.)
Spurs (5.)
Let’s now grab data for the seasons before and after (17/18 and 19/20, 20/21 and 21/22)
# should have refactored the data collection/processing loop into a functionavail_17_18 = []for player,url in cl_19_lineup_urls.items(): avail_df = players.get_player_availability(url,"2017", add_match_result=True)# add liverpool fixture data transposed_df = avail_df.T transposed_df= transposed_df.join(liverpool_fix_17_18, how="right", rsuffix="_lpool") transposed_df['is_lpool'] = transposed_df.apply(is_liverpool, axis=1) transposed_df.iloc[:,0] = transposed_df.apply(add_diff_team_availability, axis=1) transposed_df = pd.DataFrame(transposed_df.iloc[:,0]).T avail_17_18.append(transposed_df)avail_17_18_all = pd.concat(avail_17_18)avail_17_18_all.fillna(1, inplace=True)# add countlong_avail_17_18_df = avail_17_18_all.Tlong_avail_17_18_df['strangers_count'] = (long_avail_17_18_df ==4 ).sum(axis=1)long_avail_17_18_df.reset_index(inplace=True, drop=True)#| echo: falseliverpool_fix_19_20 = teams.get_team_fixtures(prem_clubs_18["Liverpool FC"], "2019")avail_19_20 = []for player,url in cl_19_lineup_urls.items(): avail_df = players.get_player_availability(url,"2019", add_match_result=True)# add liverpool fixture data transposed_df = avail_df.T transposed_df= transposed_df.join(liverpool_fix_19_20, how="right", rsuffix="_lpool") transposed_df['is_lpool'] = transposed_df.apply(is_liverpool, axis=1) transposed_df.iloc[:,0] = transposed_df.apply(add_diff_team_availability, axis=1) transposed_df = pd.DataFrame(transposed_df.iloc[:,0]).T avail_19_20.append(transposed_df)avail_19_20_all = pd.concat(avail_19_20)avail_19_20_all.fillna(1, inplace=True)# add countlong_avail_19_20_df = avail_19_20_all.Tlong_avail_19_20_df['strangers_count'] = (long_avail_19_20_df ==4 ).sum(axis=1)long_avail_19_20_df.reset_index(inplace=True, drop=True)#add 2020/2021liverpool_fix_20_21 = teams.get_team_fixtures(prem_clubs_18["Liverpool FC"], "2020")avail_20_21 = []for player,url in cl_19_lineup_urls.items(): avail_df = players.get_player_availability(url,"2020", add_match_result=True)# add liverpool fixture data transposed_df = avail_df.T transposed_df= transposed_df.join(liverpool_fix_20_21, how="right", rsuffix="_lpool") transposed_df['is_lpool'] = transposed_df.apply(is_liverpool, axis=1) transposed_df.iloc[:,0] = transposed_df.apply(add_diff_team_availability, axis=1) transposed_df = pd.DataFrame(transposed_df.iloc[:,0]).T avail_20_21.append(transposed_df)avail_20_21_all = pd.concat(avail_20_21)avail_20_21_all.fillna(1, inplace=True)# add countlong_avail_20_21_df = avail_20_21_all.Tlong_avail_20_21_df['strangers_count'] = (long_avail_20_21_df ==4 ).sum(axis=1)long_avail_20_21_df.reset_index(inplace=True, drop=True)#add 2021/2022liverpool_fix_21_22 = teams.get_team_fixtures(prem_clubs_18["Liverpool FC"], "2021")avail_21_22 = []for player,url in cl_19_lineup_urls.items(): avail_df = players.get_player_availability(url,"2021", add_match_result=True)# add liverpool fixture data transposed_df = avail_df.T transposed_df= transposed_df.join(liverpool_fix_21_22, how="right", rsuffix="_lpool") transposed_df['is_lpool'] = transposed_df.apply(is_liverpool, axis=1) transposed_df.iloc[:,0] = transposed_df.apply(add_diff_team_availability, axis=1) transposed_df = pd.DataFrame(transposed_df.iloc[:,0]).T avail_21_22.append(transposed_df)avail_21_22_all = pd.concat(avail_21_22)avail_21_22_all.fillna(1, inplace=True)# add countlong_avail_21_22_df = avail_21_22_all.Tlong_avail_21_22_df['strangers_count'] = (long_avail_21_22_df ==4 ).sum(axis=1)long_avail_21_22_df.reset_index(inplace=True, drop=True)# concatenate all our data all_fix_dates = [*avail_17_18_all.columns, *liverpool_fix.index,*avail_19_20_all.columns, *avail_20_21_all.columns,*avail_21_22_all.columns]all_avail = pd.concat([long_avail_17_18_df, fixtures_num_starters, long_avail_19_20_df, long_avail_20_21_df,long_avail_21_22_df])# reset index so we dont have to deal with dodgy dates in axesall_avail.reset_index(inplace=True, drop=True)all_avail['date'] = all_fix_datesall_avail.tail()
virgil-van-dijk
andrew-robertson
alisson
georginio-wijnaldum
roberto-firmino
jordan-henderson
sadio-mane
joel-matip
fabinho
trent-alexander-arnold
mohamed-salah
strangers_count
date
282
4.0
1.0
4.0
-1.0
2.0
3.0
4.0
4.0
4.0
4.0
3.0
6
2022-05-10
283
4.0
4.0
4.0
-1.0
3.0
4.0
4.0
3.0
0.0
4.0
4.0
7
2022-05-14
284
0.0
2.0
4.0
-1.0
4.0
3.0
1.0
4.0
0.0
1.0
1.0
3
2022-05-17
285
2.0
4.0
4.0
-1.0
3.0
4.0
4.0
4.0
0.0
4.0
3.0
6
2022-05-22
286
4.0
4.0
4.0
-1.0
3.0
4.0
4.0
2.0
4.0
4.0
4.0
8
2022-05-28
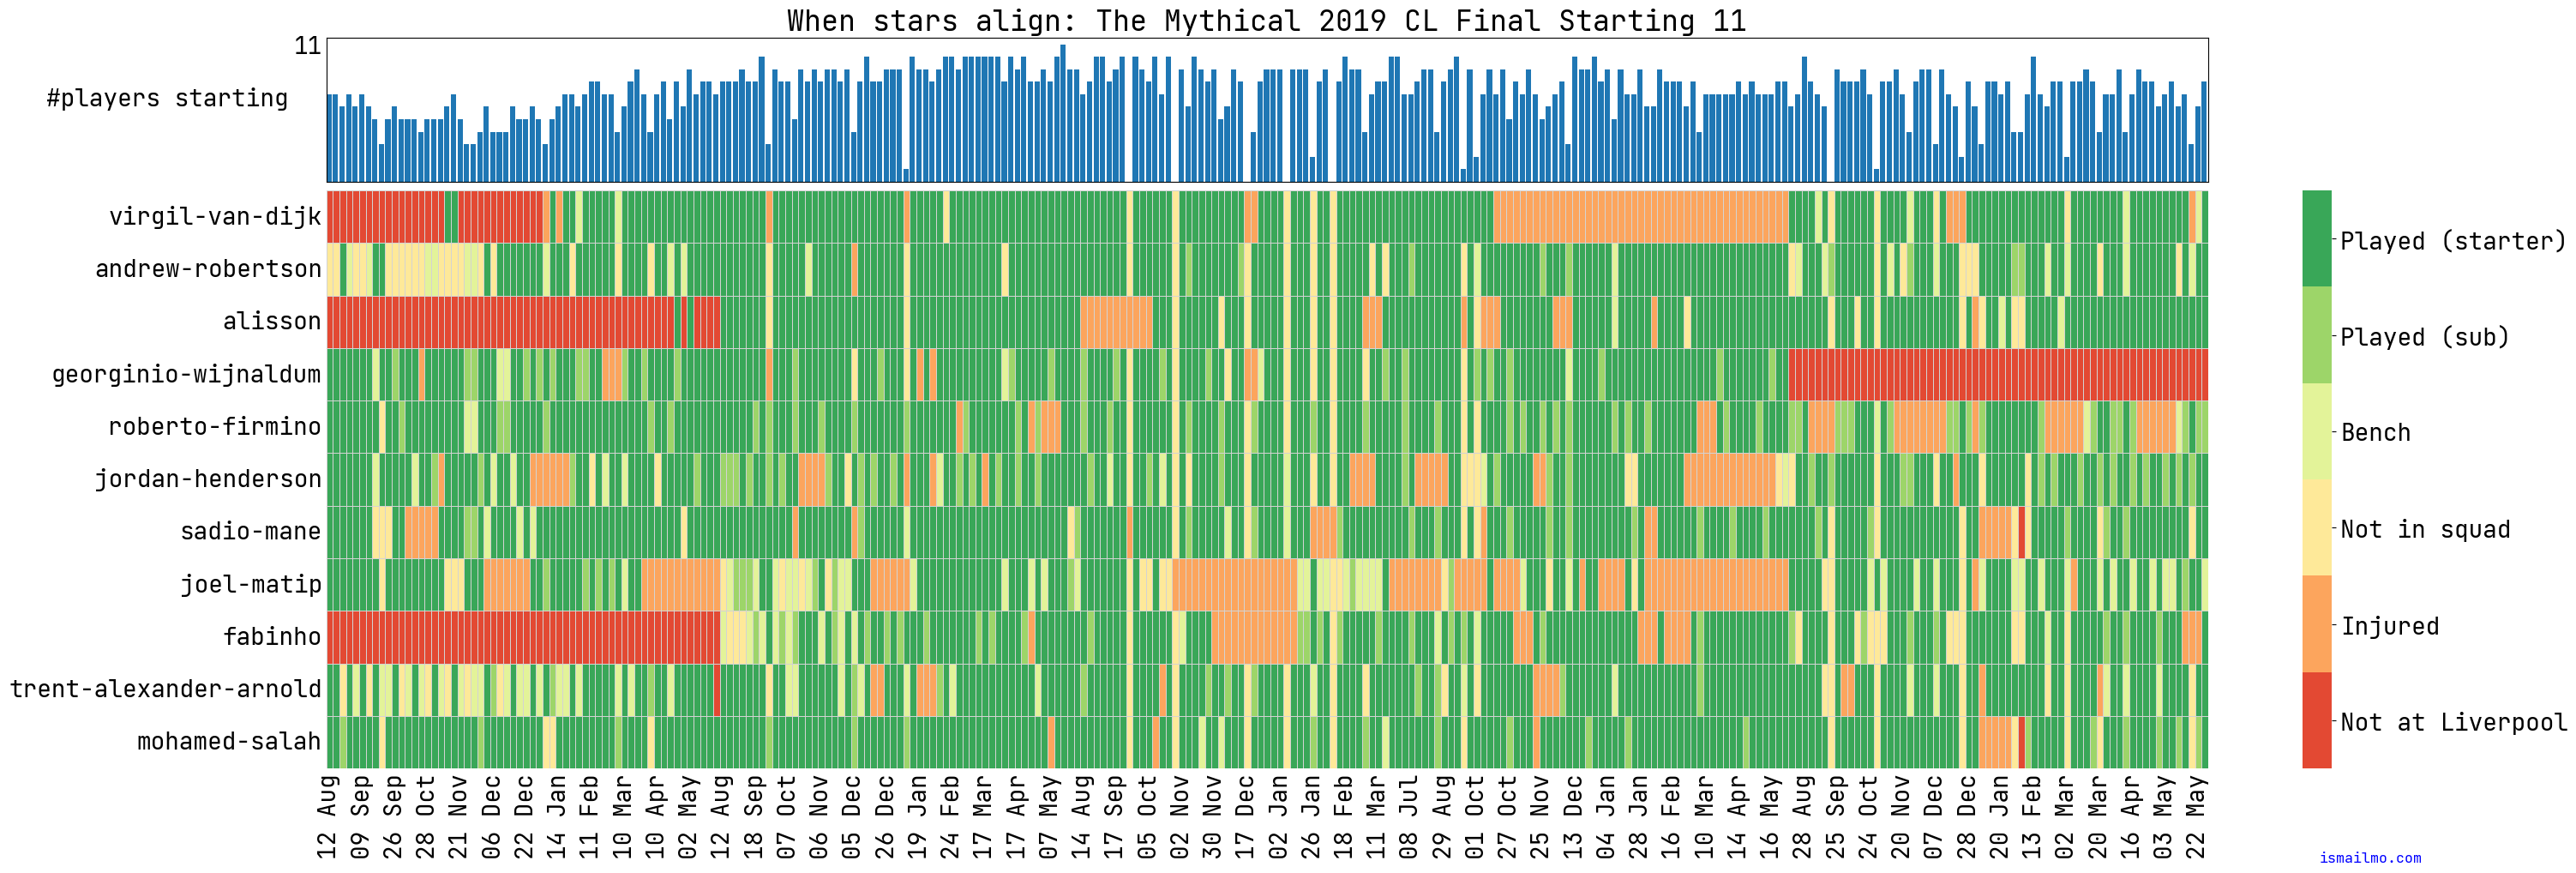
To address some of the ugliness from the initial visualisation we can make some changes in the visualisation setup (expand code and see comments):
Visualisation setup
availability_levels_map = {'Not at Liverpool' : -1,'Injured':0, 'Not in squad':1,'Bench':2, 'Played (sub)':3,'Played (starter)':4 }fig,(ax1,ax2) = plt.subplots(figsize=(30,10), nrows=2, sharex=True, height_ratios=[1, 4], constrained_layout=True)# align bars to edge so its aligned with the heatmapbar_plot = ax1.bar(all_avail.index, all_avail["strangers_count"], align="edge")# remove x axis label (since we share with heatmap)_ = ax1.set_xlabel("")_ = ax1.tick_params(length=0)# add bar graph y label and only add tick label to max #players_ = ax1.set_ylabel("#players starting",rotation="horizontal", ha="right" )_ = ax1.yaxis.set_major_locator(matplotlib.ticker.FixedLocator([11]))_ = ax1.set_title("When stars align: The Mythical 2019 CL Final Starting 11")num_levels =len(availability_levels_map.keys())plot = sns.heatmap(all_avail.iloc[:, :-2].T, ax=ax2, cmap=sns.color_palette("RdYlGn",num_levels),linewidths=0.5, linecolor='lightgray')# map colorbar labels with availability levelscolorbar = plot.collections[0].colorbartotal_bar_height = colorbar.vmax - colorbar.vmin lvl_bar_height = total_bar_height/num_levelscolorbar.set_ticks([colorbar.vmin + (lvl_bar_height * (0.5+ i)) for i inrange(num_levels)])colorbar.set_ticklabels([*availability_levels_map.keys()])# gotta love dates - format them so they look cleaneraxs_fmtd = [all_avail.loc[int(i.get_text()), 'date'].strftime("%d %b") for i in ax2.get_xticklabels()]_ = ax2.set_xticklabels(axs_fmtd, rotation="vertical")_ = ax2.set_xlabel("")_ = ax2.tick_params(length=0)_ = plt.gcf().text(0.9, 0, "ismailmo.com", fontsize=12, fontdict={'color': 'blue'} )
There are some anomalies where players are marked as “Not at liverpool” even though they definitely were (see Trent, Mane and salah’s red lines)
Mane and Salah were playing eachother at the AFCON final - so technically the graph is correct :)
sadio-mane
date
258
-1.0
2022-02-06
sadio-mane
date
258
-1.0
2022-02-06
For Trent, the England U21 team were playing at the same time (which Trent used to play for) so our logic that adjusted for games played for other clubs (e.g. Van Dijk for Southampton) picked up this game- since this is a rare edge case I’ll just overwrite it manually
The visualisation above shows that the full squad were only playing for Liverpool FC during 2018/19 - 2021-22 (see the blocks of red at the start and end of the heatmap) - we can remove the other seasons (we’ll keep a few rows to highlight their departure/arrival at Liverpool).
Another key change is choosing a better colours palette - ColorBrewer is a great resource for finding accessible color schemes based on the research of Dr Cynthia Brewer
# order players by positionheatmap_data = cl_19_lineup_at_lpool_avail_df.loc[:, ['mohamed-salah','roberto-firmino','sadio-mane','jordan-henderson','fabinho','georginio-wijnaldum','andrew-robertson','virgil-van-dijk','joel-matip','trent-alexander-arnold','alisson']].Tmatplotlib.rcParams['font.size'] ='20'plt.rcParams["axes.titlesize"] ="10"color_scheme = ['#b2182b','#ef8a62','#fddbc7','#d1e5f0','#67a9cf','#2166ac']alt_color_scheme = ['#762a83','#af8dc3','#e7d4e8','#d9f0d3','#7fbf7b','#1b7837']availability_levels_map = {'Not at Liverpool' : -1,'Injured':0, 'Not in squad':1,'Bench':2, 'Played (sub)':3,'Played (starter)':4 }fig,(ax1,ax2) = plt.subplots(figsize=(30,10), nrows=2, sharex=True, height_ratios=[1, 4], constrained_layout=True)bar_plot = ax1.bar(cl_19_lineup_at_lpool_avail_df.index, cl_19_lineup_at_lpool_avail_df["strangers_count"], align="edge")# highlight champions lg final gamefor i,bar inenumerate(bar_plot):if cl_19_lineup_at_lpool_avail_df["strangers_count"][i] ==11: bar.set_color("r")ax1.spines['top'].set_visible(False)ax1.spines['right'].set_visible(False)ax1.spines['bottom'].set_visible(False)ax1.spines['left'].set_visible(False)# add horizontal line at 11 playersax1.axhline(y=11, color='r', ls='--')_ = ax1.set_title("When stars align: The 2019 CL Final Starting 11", fontdict={"fontsize":"25"} )_ = ax1.set_xlabel("")_ = ax1.set_ylabel("#players",rotation="vertical", ha="center")_ = ax1.yaxis.set_major_locator(matplotlib.ticker.FixedLocator([11]))_ = ax1.tick_params(length=0)num_levels =len(availability_levels_map.keys())plot = sns.heatmap(heatmap_data, ax=ax2, cmap=color_scheme,linewidths=0.5, linecolor='lightgray')colorbar = plot.collections[0].colorbartotal_bar_height = colorbar.vmax - colorbar.vmin lvl_bar_height = total_bar_height/num_levelscolorbar.set_ticks([colorbar.vmin + (lvl_bar_height * (0.5+ i)) for i inrange(num_levels)])colorbar.set_ticklabels([*availability_levels_map.keys()])axs_fmtd = [cl_19_lineup_at_lpool_avail_df.loc[int(i.get_text()), 'date'].strftime("%d %b") for i in ax2.get_xticklabels()]_ = ax2.set_xticklabels(axs_fmtd, rotation="vertical", ha="left")_ = ax2.set_xlabel("")_ = ax2.tick_params(length=0)_ = plt.gcf().text(0.9, 0, "ismailmo.com", fontsize=25, fontdict={'color': 'blue'} )
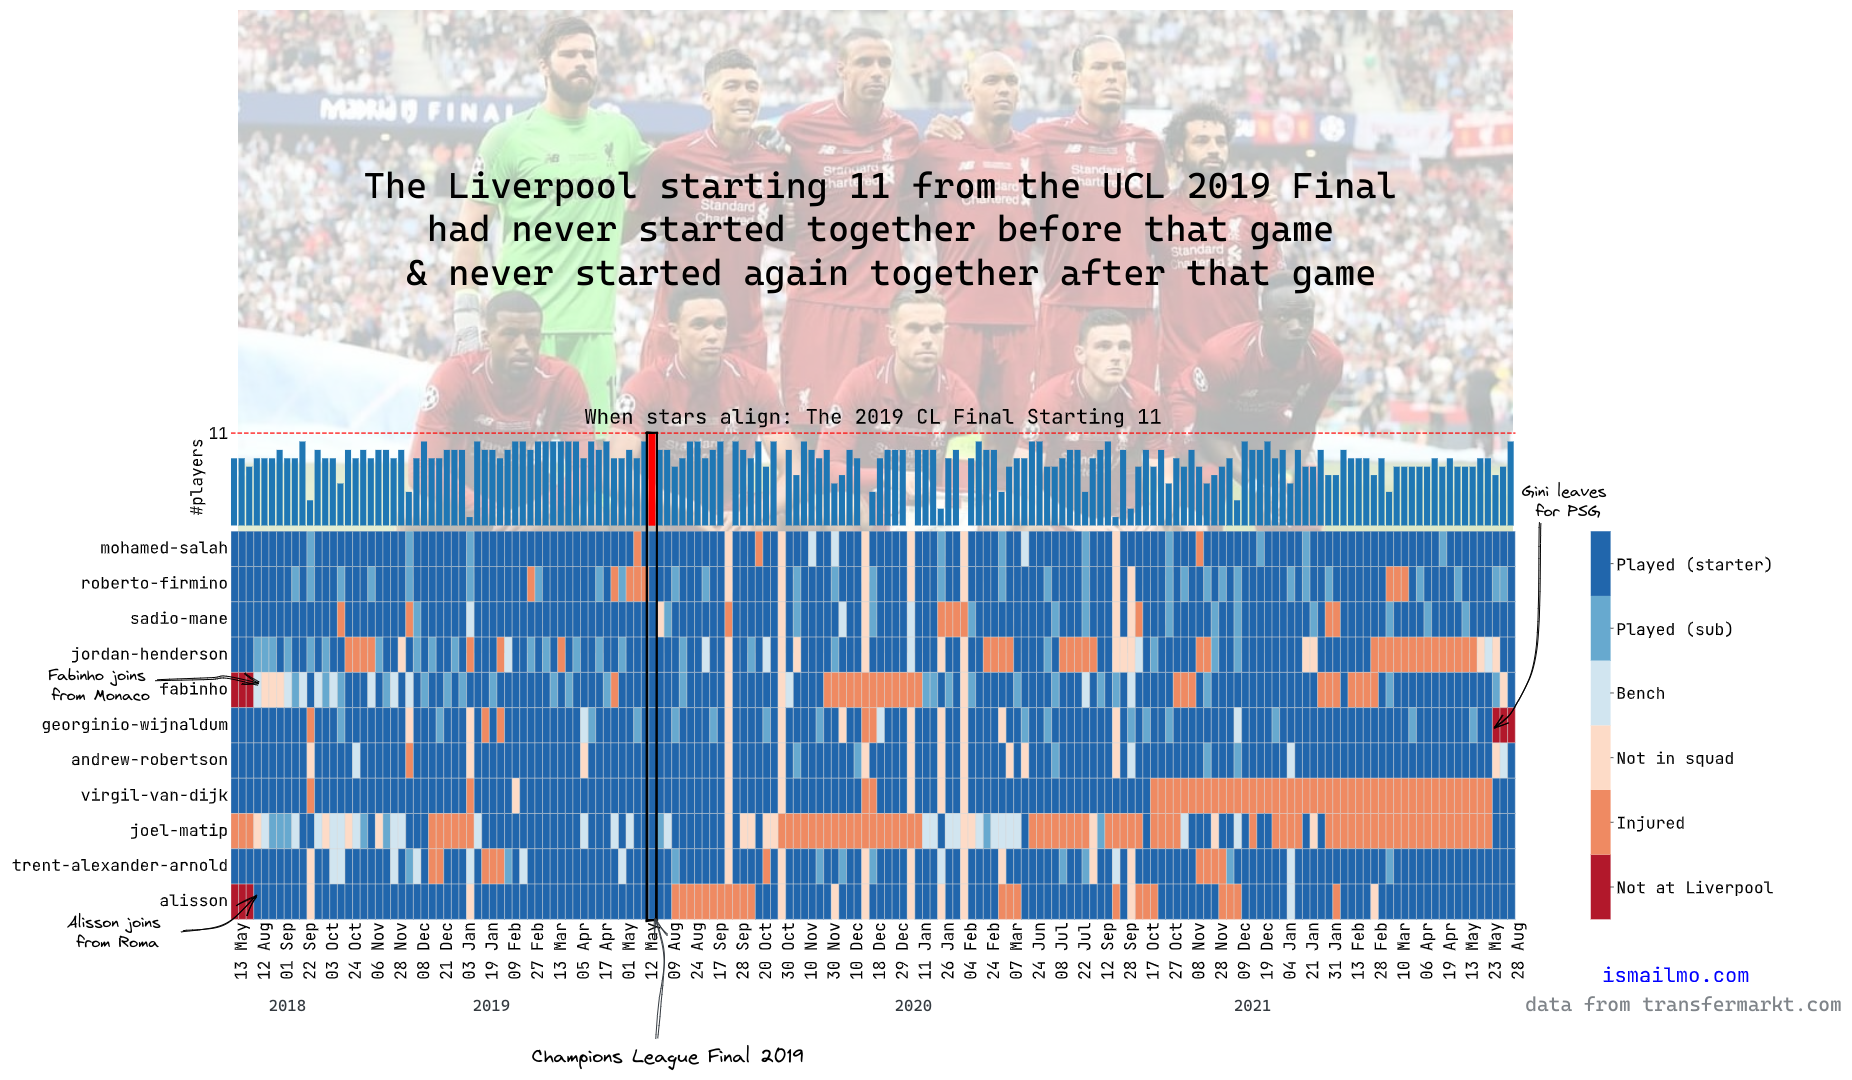
5 Final Visualisation
The final visualisation is complete, but to add some extra context I added annotations using Excalidraw to highlight some key points (probably could’ve done this in code but I got lazy):
Annotated heatmap
6 Feedback
After posting this on reddit there were some interesting suggestions for further analysis: