| Minute | Player | xG | Outcome | is_goal | |
|---|---|---|---|---|---|
| 2022-05-28 | 82 | Mohamed Salah | 0.16 | Saved | False |
| 2022-10-12 | 53 | Darwin Núñez | 0.19 | Blocked | False |
| 2022-03-12 | 19 | Luis Díaz | 0.16 | Goal | True |
| 2021-03-10 | 70 | Mohamed Salah | 0.27 | Goal | True |
| 2021-04-22 | 50 | Darwin Núñez | 0.30 | Goal | True |
Despite his 10 goals in 23 games (at the time of writing), Darwin Nunez’s finishing has been questioned by some since he joined Liverpool in the summer of 2022. Some of this criticism is due to the inevitable comparison with Manchester City’s summer signing of Erling Haaland who has taken the league by storm with his 27 goals in 24 games so far.
It feels as though Nunez loses his composure in front of goals with easier chances but looks calmer with more difficult chances when he isn’t expected to score. To put this “feeling” to the test, we can look at the difficulty of chances that are scored vs ones that are missed with the help of the expected goals (xG) metric.
1 Data source
To help make a judgement on the quality of chances missed vs scored, xG data was required at the finest granularity level: each individual shot by a player.
You can read about how data was scraped from fbref while still respecting the API limits here (coming soon!).
2 Visualising all shots
Finding a balance between visualising all the individual shot data points and not making the plot too busy was the key goal of this visualisation. By using text annotations in both the y axis and the mean lines - I think a decent tradeoff was achieved with seaborn’s stripplot.
This was done fairly manually by looping through the tick labels to get x,y positions to place the annotations:
tick_label_order = [label._text for label in ax.get_yticklabels()]

for idx, label in enumerate(tick_label_order):
        num_shots = len(concat_shots[concat_shots['Player']==label])
        num_goals = len(player_goals[player_goals['Player']==label])
        shots_per_goal = num_shots/num_goals
        ax.annotate(
            f"shots: {num_shots}\ngoals: {num_goals}\nshots/goal: {shots_per_goal:.2f}",
            xy=(-0.05,idx + 0.33),
            xycoords='data',
            annotation_clip=False,
            horizontalalignment='right'
        )
The mean xG lines were added in a similar way, using the tick_label_order index to find the corresponding mean values:
mean_goal_lines = [
    (idx,mean_goal_xg[mean_goal_xg['Player']==tick]['xG'].squeeze()) for idx, tick in enumerate(tick_label_order)
    ]
# add avg xG lines
num_y_labels = len(mean_goal_lines)

for y,x in mean_goal_lines:
    y_loc = 1- (y/num_y_labels)
    y_width = 1/num_y_labels
    line_height = 1/(num_y_labels+1)

    ax.axvline(x,ymin = y_loc-line_height, ymax = y_loc - y_width + line_height, color='#1f77b4', linewidth = 4, alpha=0.5)
    offset = 10
    ax.annotate(f"{x:.2f}", (x,y), xytext=(offset/2, 2*offset), textcoords='offset points')

# repeat for mean xg of shots missed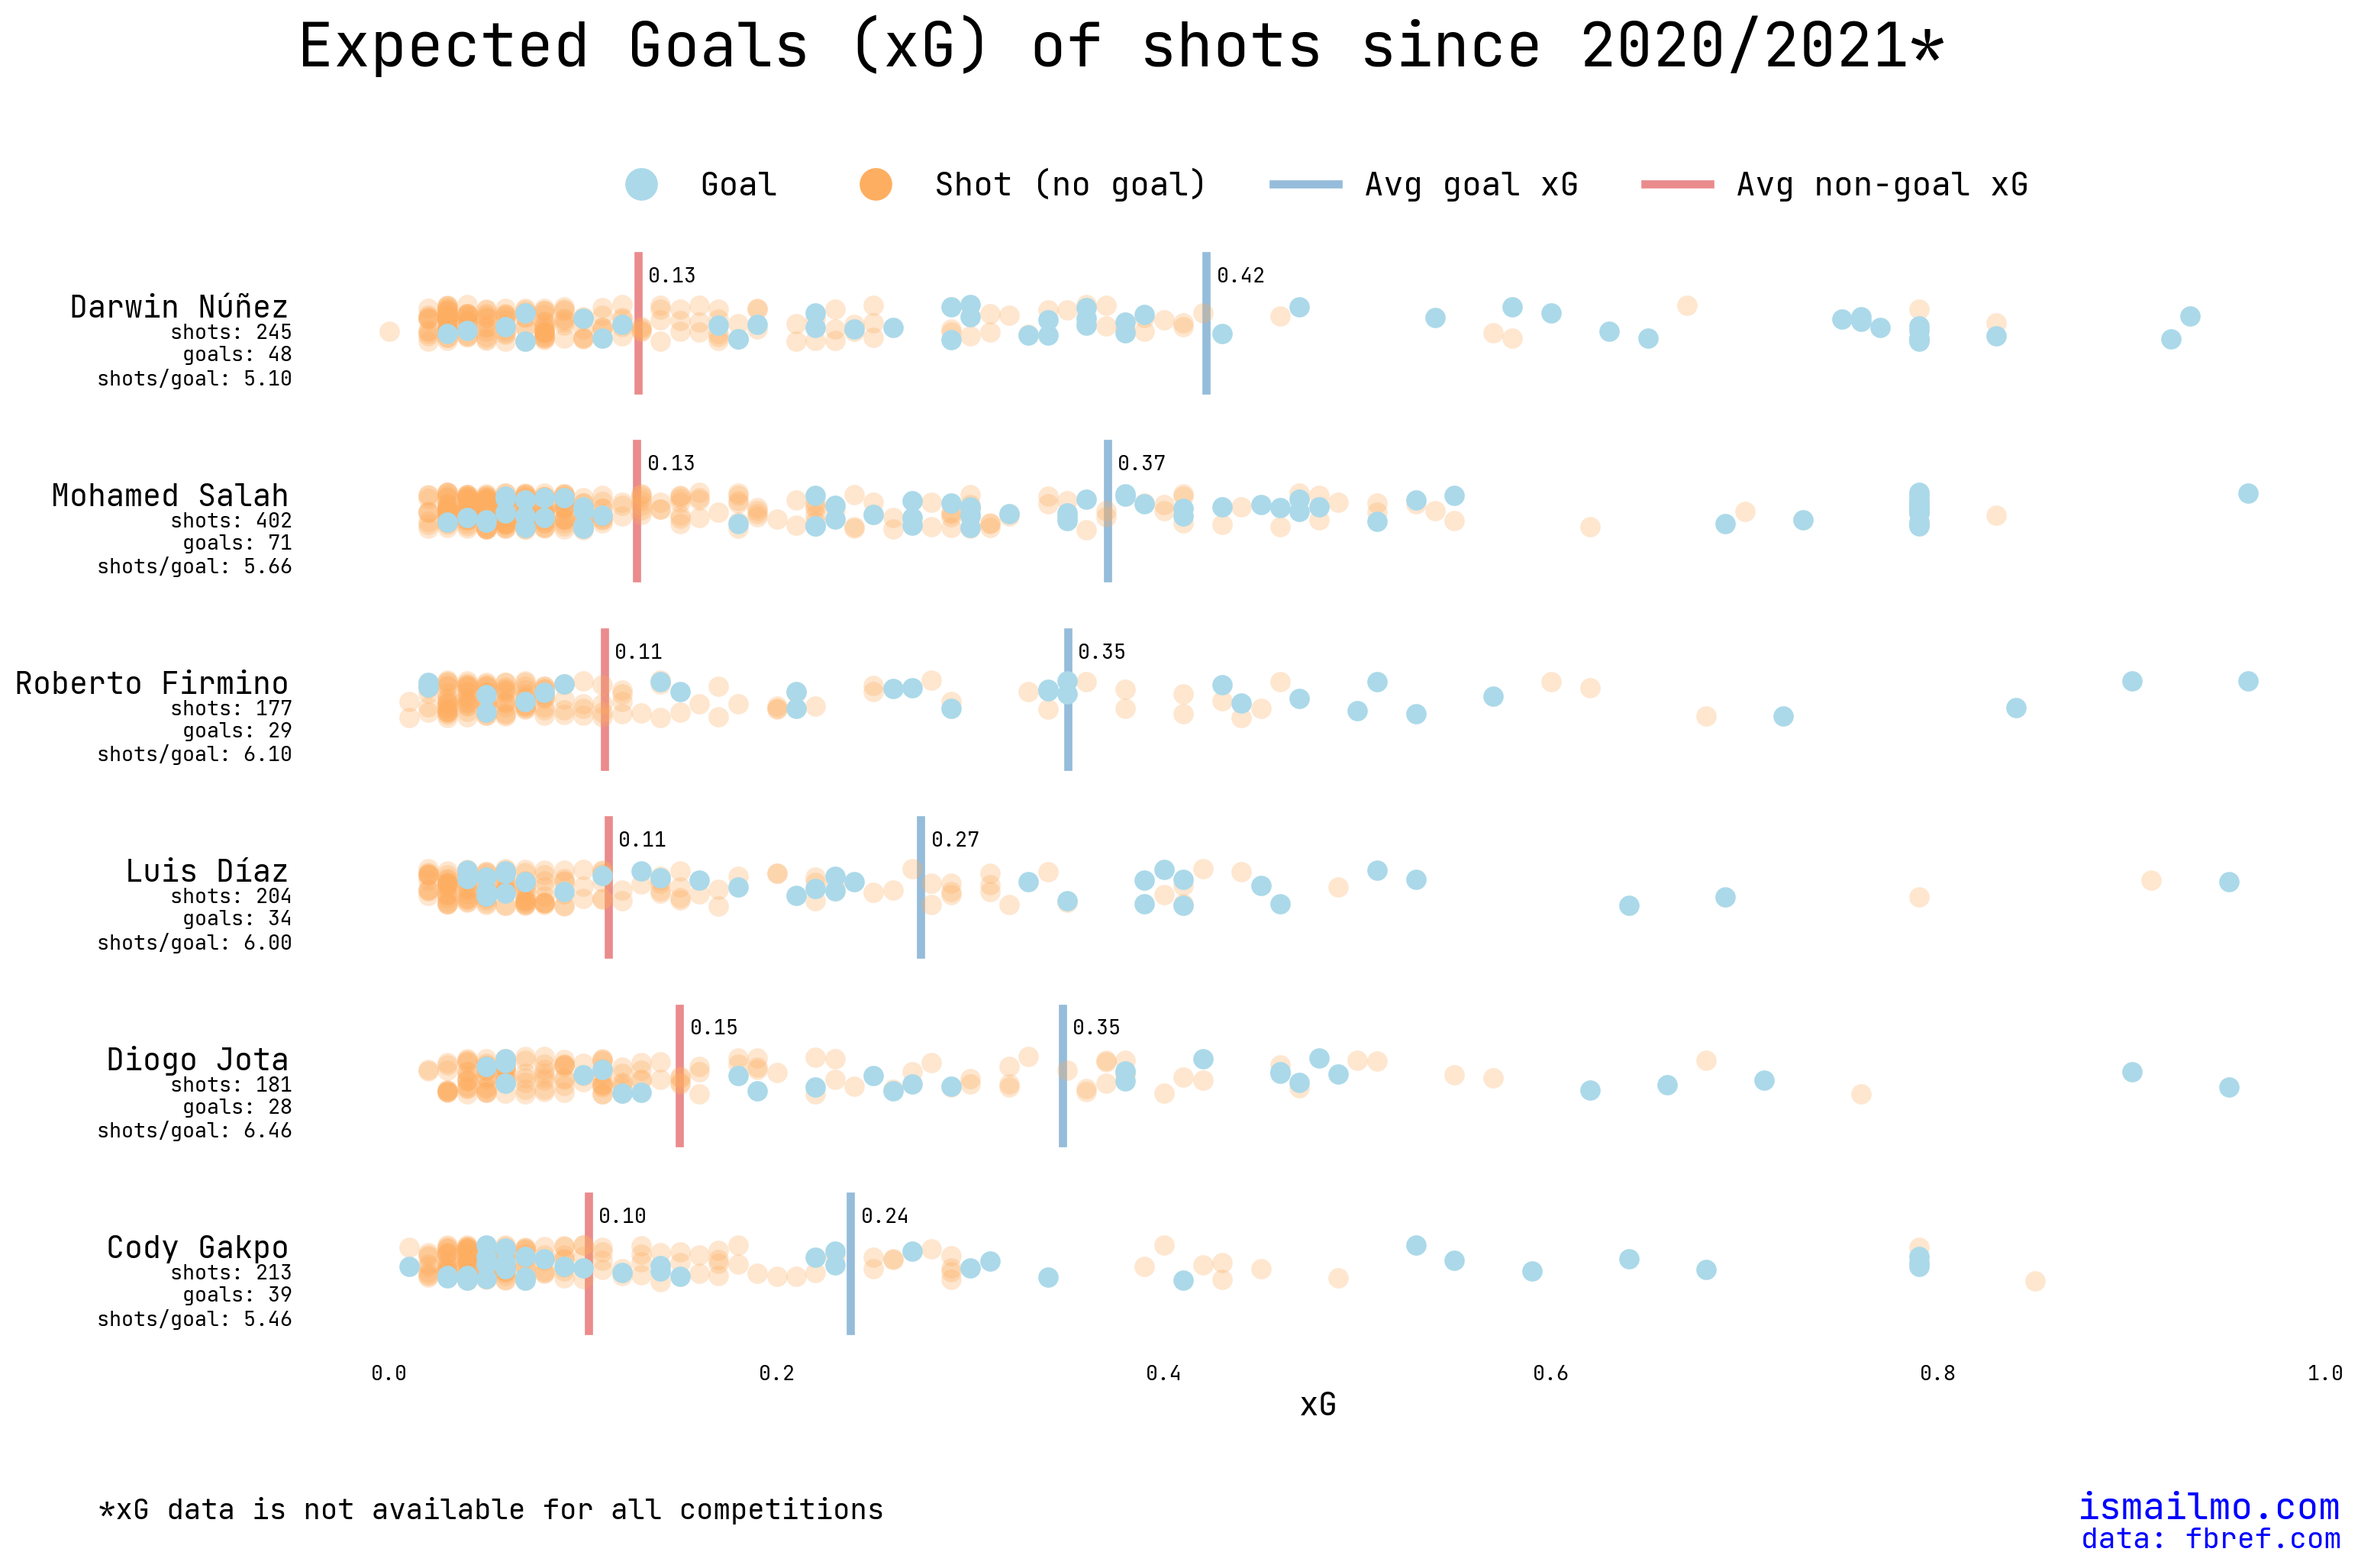
3 Adding contextual data
There are a few interesting data points in the plot above, so it would be cool to be able to search up the goal or missed shot - e.g. the Cody Gakpo goal with an xG of ~0.01 or the chance Luis Diaz missed with an xG of ~0.95.
The static plot is already at the limits of how noisy I would want to get, but we can use an interactive plotting tool like plotly to add more data without ruining the simplicity of the plot.
First we can add the match data:
| date | Minute | Player | xG | Outcome | Venue | Result | Squad | Opponent | is_goal | |
|---|---|---|---|---|---|---|---|---|---|---|
| 754 | 2021-09-12 | 49 | Mohamed Salah | 0.10 | Blocked | Away | W 3–0 | Liverpool | Leeds United | False |
| 566 | 2022-04-05 | 90+7 | Diogo Jota | 0.30 | Saved | Away | W 3–1 | eng Liverpool | pt Benfica | False |
| 1369 | 2022-10-04 | 43 | Darwin Núñez | 0.16 | Saved | Home | W 2–0 | eng Liverpool | sct Rangers | False |
| 28 | 2021-03-21 | 24 | Cody Gakpo | 0.25 | Saved | Away | L 0–2 | PSV Eindhoven | AZ Alkmaar | False |
| 813 | 2021-12-04 | 90 | Mohamed Salah | 0.06 | Saved | Away | W 1–0 | Liverpool | Wolves | False |
Then plot the data using plotly.express.stripplot:
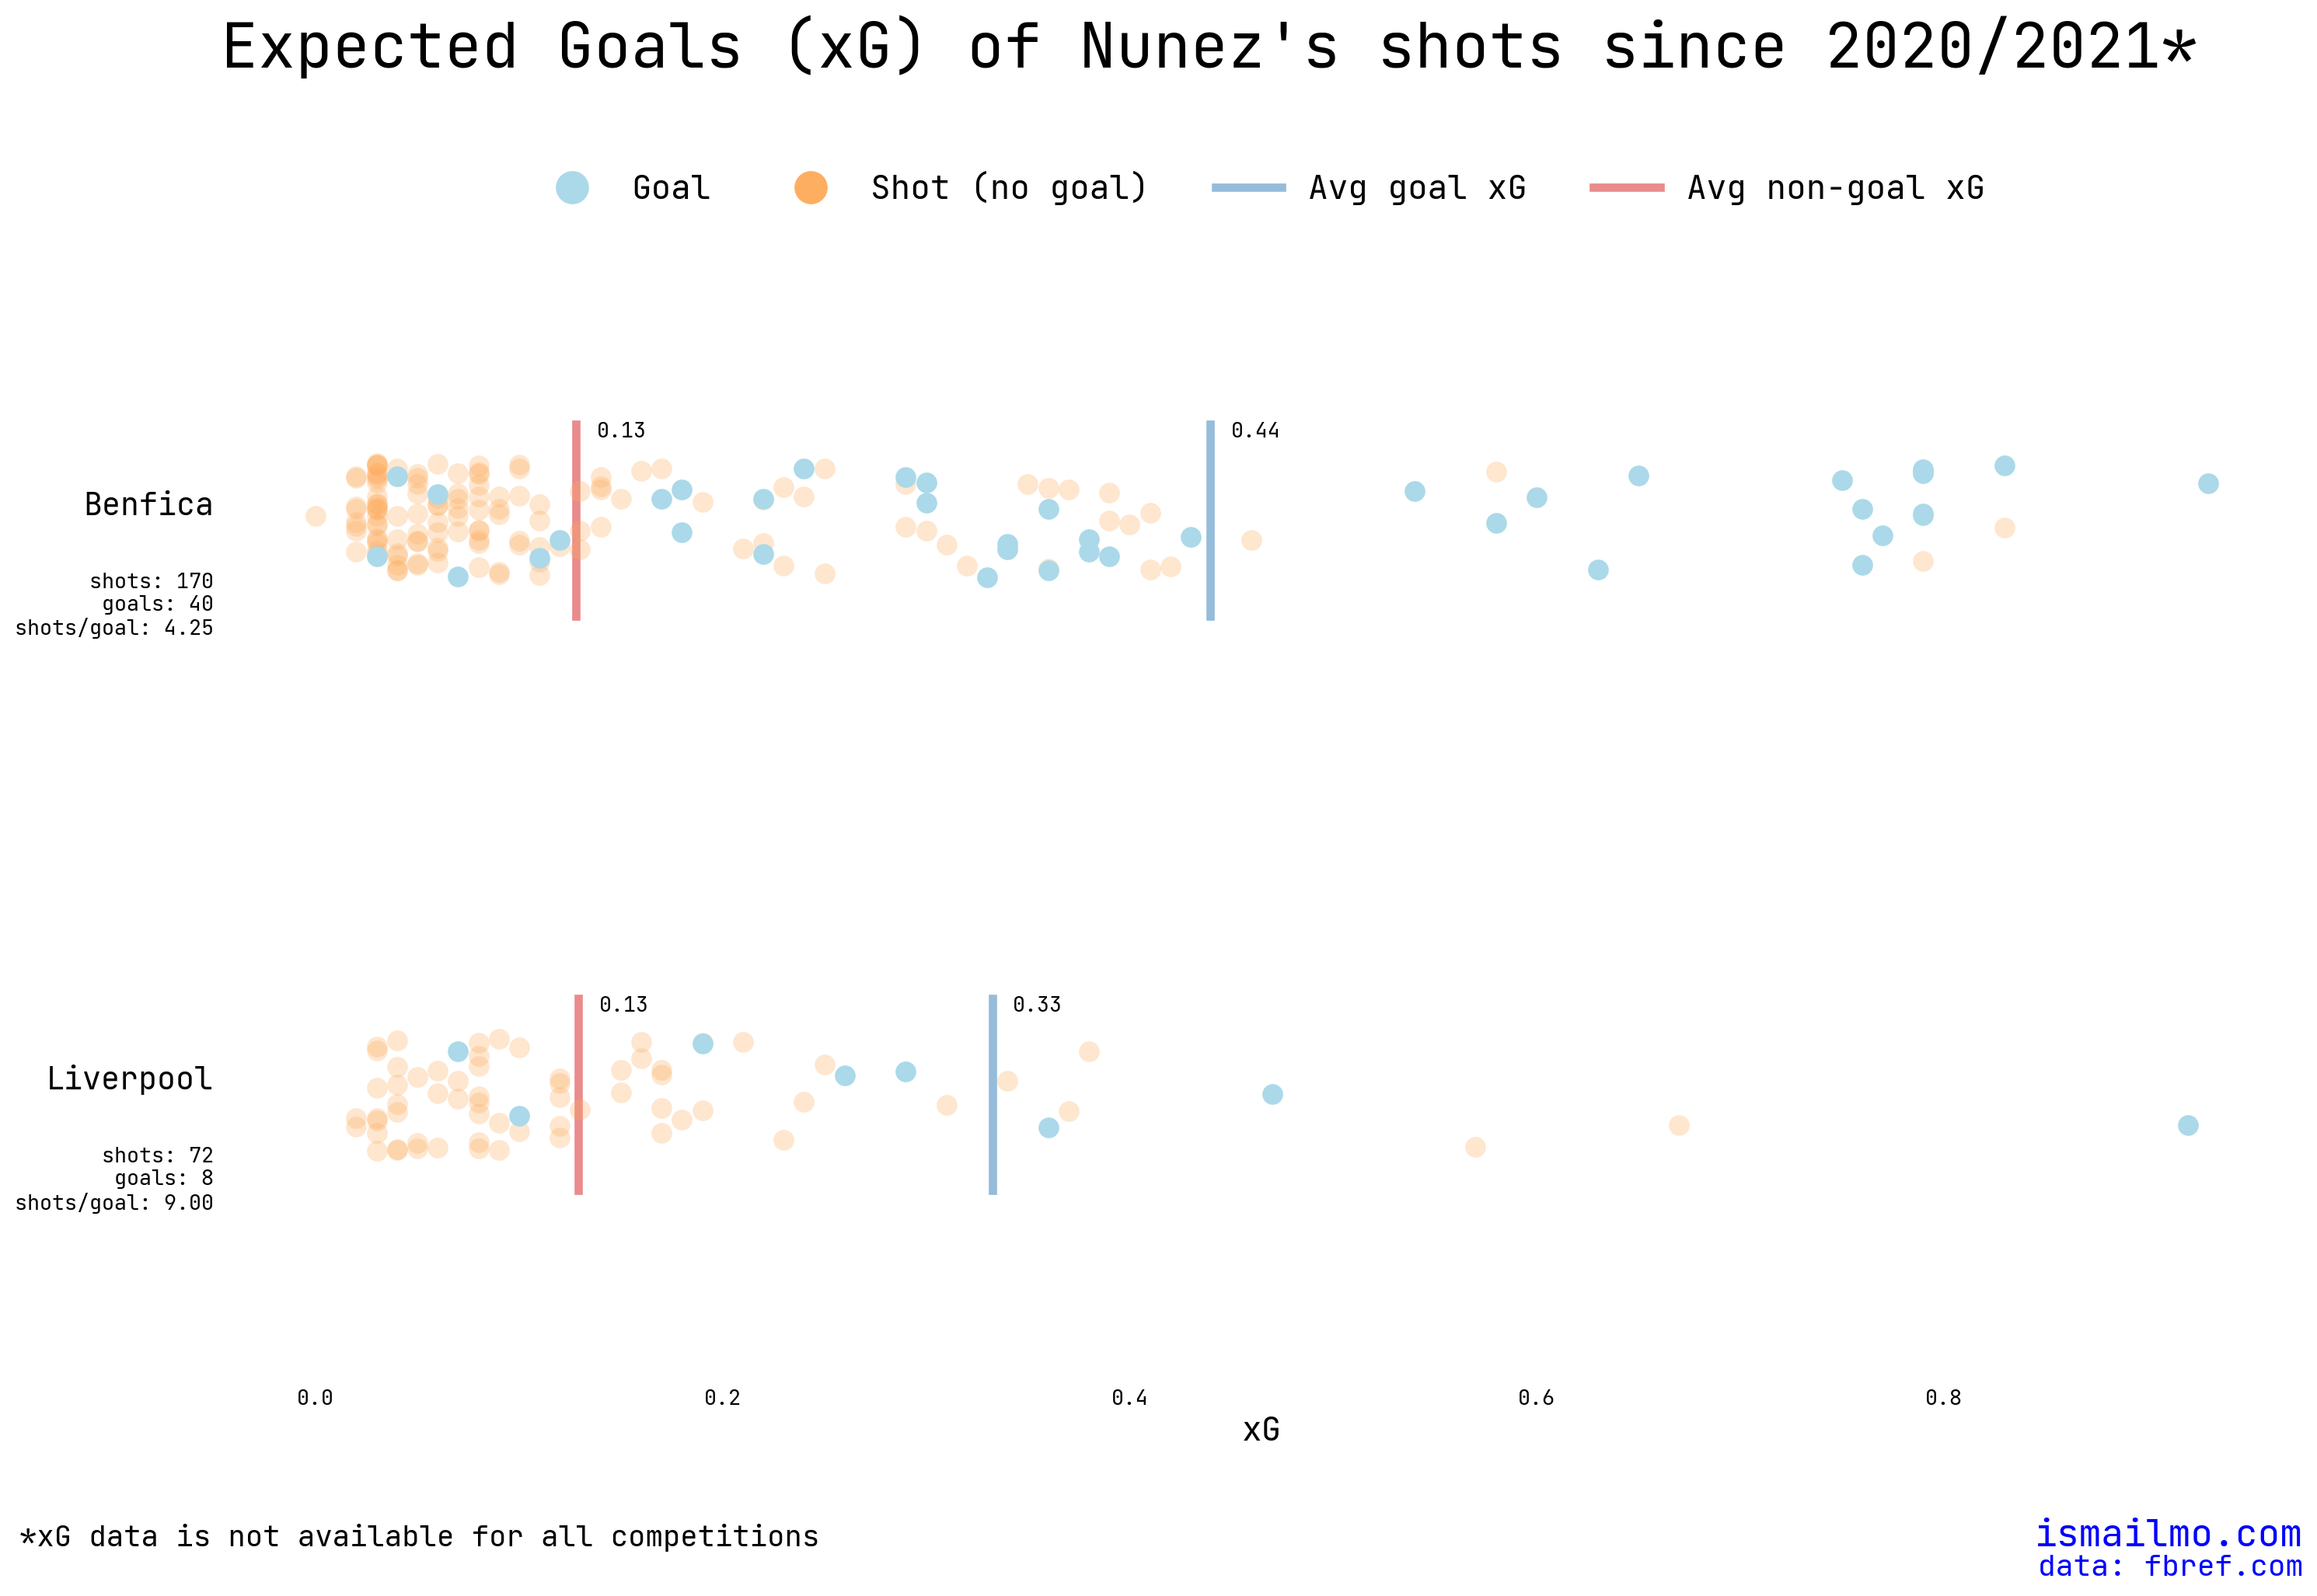
4 Is Liverpool is the problem?
Given Liverpool’s run of form this season, and the extra pressure of moving to a new country, there’s plenty of cause for Nunez to be fluffing his shots more than usual this season. Now that we have match data, we can easily split the shots at Liverpool and previous clubs:
concat_shots['Squad'] = concat_shots['Squad'].apply(lambda x:x.split(" ")[-1])
nunez_shots = concat_shots[concat_shots['Player'] == 'Darwin Núñez']
#remove uruguay
nunez_shots.drop(nunez_shots[nunez_shots['Squad'] =='Uruguay'].index, inplace=True)
nunez_shots.sample(5)| date | Minute | Player | xG | Outcome | Venue | Result | Squad | Opponent | is_goal | |
|---|---|---|---|---|---|---|---|---|---|---|
| 1309 | 2022-02-27 | 52 | Darwin Núñez | 0.79 | Goal | Home | W 3–0 | Benfica | Vitória | True |
| 1237 | 2021-02-14 | 29 | Darwin Núñez | 0.03 | Off Target | Away | D 1–1 | Benfica | Moreirense | False |
| 1185 | 2020-10-04 | 84 | Darwin Núñez | 0.05 | Blocked | Home | W 3–2 | Benfica | Farense | False |
| 1332 | 2022-04-13 | 83 | Darwin Núñez | 0.03 | Saved | Away | D 3–3 | Benfica | eng Liverpool | False |
| 1178 | 2020-09-18 | 24 | Darwin Núñez | 0.11 | Off Target | Away | W 5–1 | Benfica | Famalicão | False |
The sample size for Benfica is a lot larger (60 games at Benfica vs 19 games at Liverpool), but from the plot below we can see that while Nunez’s shots/goal is almost double what it was at Benfica - there’s no difference in the average xG of the shots he’s been missing. The average xG for goals is a lot higher at Benfica suggesting that Nunez is actually scoring more difficult chances at Liverpool - so atleast that part of the initial feeling was true.
To test out whether Nunez is actually taking more shots at Liverpool we can just look at the number of shots per game:
nunez_lpool_shots = nunez_shots[nunez_shots['Squad']=='Liverpool']
nunez_benfica_shots = nunez_shots[nunez_shots['Squad']!='Liverpool']

num_lpool_games = len(nunez_lpool_shots['date'].unique())
num_benfica_games = len(nunez_benfica_shots['date'].unique())


print(
    f"shots/game at Liverpool: {len(nunez_lpool_shots)/num_lpool_games:.2f}\n"
    f"shots/game at Benfica: {len(nunez_benfica_shots)/num_benfica_games:.2f}"
)
shots/game at Liverpool: 3.79
shots/game at Benfica: 2.83And they seem to be lower quality too: